
I recently ran into a funny bug with deep links.
Sometimes, when tapping a push notification, some users reported the destination screen appearing twice - the app would open, navigate to the correct screen, but the screen push transition would happen twice.
I began investigating, unaware how deep this rabbit hole would go.
How Deep Linking Works
Before debugging, it's critical to ensure we understand the system we're working with, so let's get on the same page about deep linking.
My app had a fairly commonplace coordinator-based architecture: an AppCoordinator at the top-level, with child coordinators for each tab. These handled navigation throughout the app. Check out SwiftUI Apps at Scale for more details if you're not familiar with this architecture.
Deep links allow users to directly navigate to a specific screen in your app from a hyperlink or push notification. These are a vital tool for app engagement.
We built deep linking using a DeepLinkHandler at the top level, passing its interface into each coordinator of the app.
public protocol DeepLinkHandler {
  func open(url: URL)
  func publisher(for link: DeepLink) -> AnyPublisher<Void, Never>
}
Our top-level SceneDelegate responded to links via a delegate callback scene(openURLContexts:), passing the URL to our deep link handler.
Internally, the deep link handler used a regex to convert the URL into a DeepLink enum case, sending a signal to the link's corresponding Combine publisher.
The child coordinators were wired up to listen to specific publishers, and triggered navigation when they received a signal from DeepLinkHandler:
// MyDataCoordinator.swift
func listenToDeepLinks() {
  deepLinkHandler
      .publisher(for: .myDataDeepLink)
      .sink { [weak self] in
          self?.navigate(to: .myDataScreen)
      }
      .store(in: &cancellables)
}
This setup worked pretty well up until now.
Seeking Repro
Once we understand the intended behaviour of a system, the most critical factor in bug-fixing is repro - the steps required to reliably reproduce the issue.
I won't bore you with my (embarrassingly lengthy) investigation, but I eventually achieved the gold standard for repro - steps to replicate the bug 100% of the time.
When I logged out, and back in, then deep links would always cause this double-push-navigation-animation. If I quit and re-launched the app, starting a new app session, the deep links worked as normal.
This critical clue told me where to look next.
Lots of print statements
I'll admit I'm a boomer when it comes to debugging.
Xcode gives us a plethora of fancy debugging tools, from breakpoints with executable code, to stepping into call stacks with the LLDB debugger.
But I like good old-fashioned print statements. Lots of 'em.
Let's pepper them throughout the call stack. Following our bug repro steps - logging out and back in - we can now analyse the console output when we tap a deep link.
// SceneDelegate.swift
func scene(_ scene: UIScene, openURLContexts URLContexts: Set<UIOpenURLContext>) {
  guard let urlContext = URLContexts.first else { return }
  let url = urlContext.url
  print(url)
  deepLinkHandler.open(url: url)
}
The print in SceneDelegate behaves as expected when opening the deep link, firing just once. So we know nothing strange is happening with how the system is dealing with URLs.
// DeepLinkHandler.swift
public func open(url: URL) {
  guard let link = DeepLink.link(from: url) else { return }
  print(link)
  _publisher(for: link).send(())
}
Our deep link handler appears to be behaving normally as well; printing the link once and sending a signal to the Combine publisher.
// MyDataCoordinator.swift
func listenToDeepLinks() {
  deepLinkHandler
      .publisher(for: .myDataDeepLink)
      .sink { [weak self] in
          print(self)
          self?.navigate(to: .myDataScreen)
      }
      .store(in: &cancellables)
}
The coordinator which handles the deep link is acting odd.
It prints twice.
This might be our smoking gun. This deep link listener is triggered twice, triggering the navigate(to:) method twice, leading to the double navigation bug our users are reporting!
A memory leak
I have some finely-honed instincts from an illustrious career of writing janky code. The sort of instincts that can occasionally make me look like rain man.
- Whenever someone is seeing an unexplained 403 HTTP error, it's CORS.
- Whenever the intern's table view isn't working, they forgot to set the delegate.
- And whenever something is happening twice, it's a memory leak.
I upgraded my print statement to log the heap memory address of the coordinator instance to get us more information.
print(Unmanaged.passUnretained(self).toOpaque())Again, we run the repro steps, toggle the deep link, and observe it triggering twice. My hunch was right:
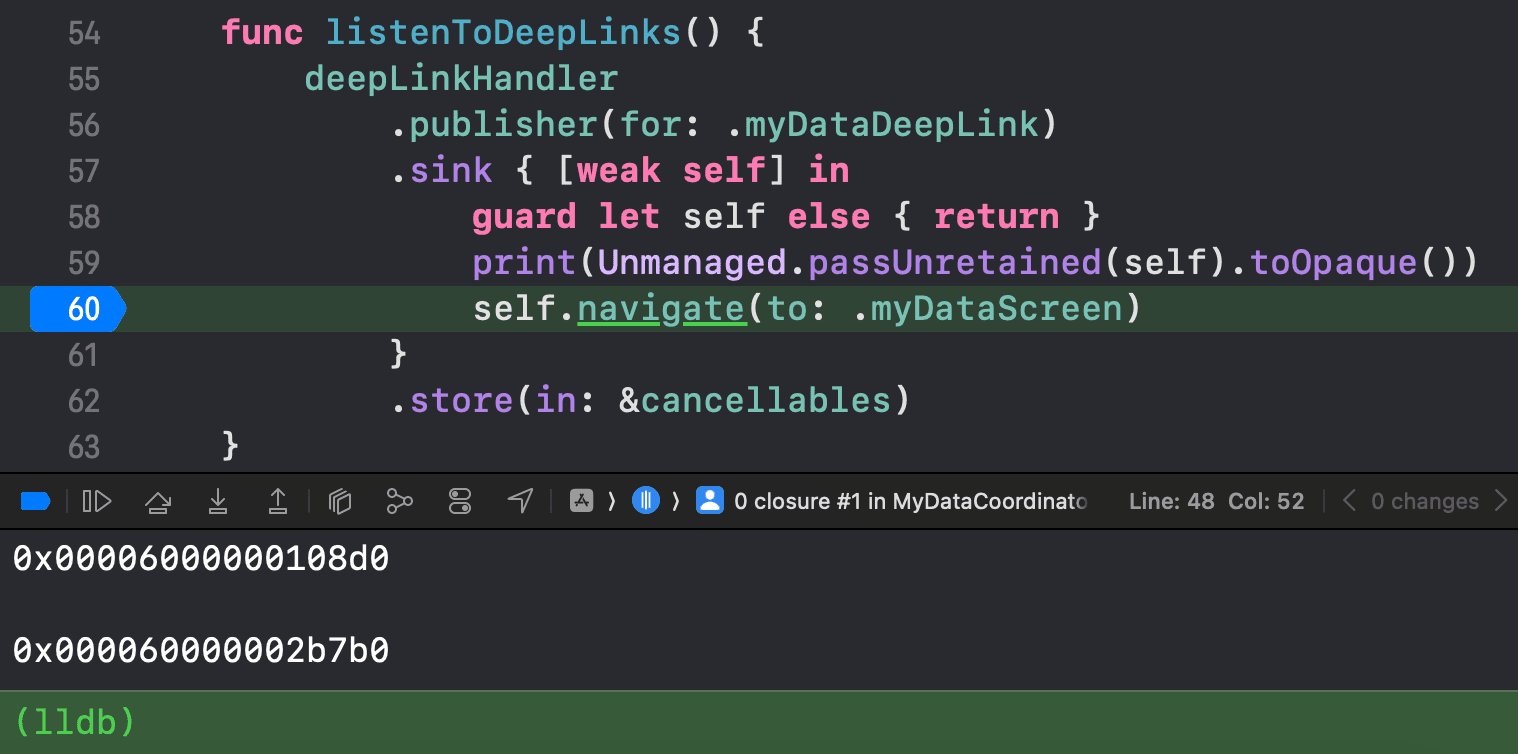
The heap memory addresses printed out by the debugger were:
0x00006000000108d00x000060000002b7b0
This meant that the deep link itself was handled once, but there were multiple instances of the coordinator handling it. This is why we observed a double push navigation.
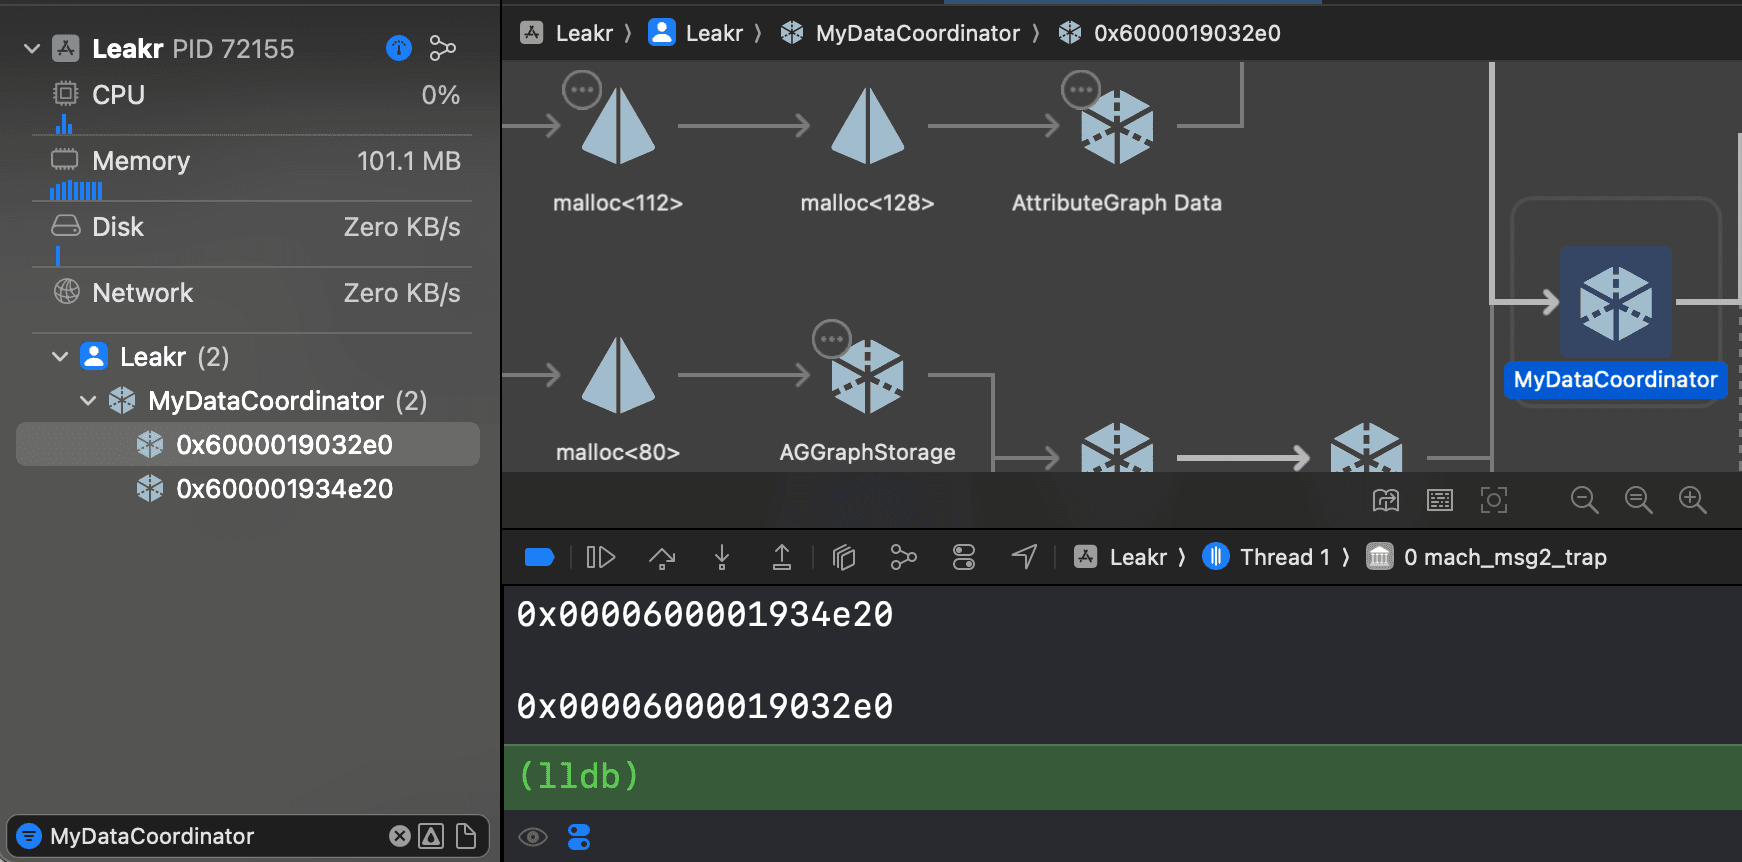
We could verify this further by looking in the Xcode Debug navigator, reproducing the bug again, and selecting "View Memory Graph Hierarchy". Here we search for the MyDataCoordinator and see both instances.
What is a memory leak?
Let's make sure we're all on the same page before we continue.
All the objects used in a running program are kept alive in a computer's RAM, or memory (yes, I know this is a slight simplification).
To avoid hogging all the resources of a computer system, programming languages are designed to "let go" of memory a program doesn't need anymore. Depending on how a language is designed, this memory management could be:
- Manual memory management like in C/C++, where developers use
mallocandreleaseto allocate and let go of memory themselves. - Languages like Kotlin or Java have a "garbage collector" which periodically traverses the system memory and removes unused objects.
- Rust uses a compiler-safe system of ownership to determine when to drop memory for an object.
Swift handles memory using reference counting:
- Strong references - i.e., a pointer to the address of a class in heap memory - increase refCount by 1.
- Weak references point to memory but do not increase refCount.
- When refCount of a HeapObject reaches zero, it is immediately deallocated.
In Swift, a memory leak might happen when developers make a mistake in managing these references. They might inadvertently set a strong reference - perhaps in a closure that captures self - which never deallocates, keeping the referenced object in memory forever.
If the leaked object has strong references of its own, it will also keep alive all the objects which it strongly references, in a cascading manner.
For further deep-dives into how memory works under the hood in Swift, check out COW2LLVM: The isKnownUniquelyReferenced Deep-Dive or The Case Against unowned self.
A big, big memory leak
We've got clarity now - and a pretty good understanding of the behaviour of this system:
- When you log out and back in, new instances of the main tab coordinators are recreated as you transition from onboarding & authentication screens into the main app.
- Our app had a memory leak which kept our MyDataCoordinator alive throughout the app session.
- Therefore, the deep link listener from the old coordinator was still active and caused deep link navigation to be triggered twice.
Worryingly, this suggested that the scope of the problem was far bigger than I'd expected from a relatively minor-seeming navigation issue.
The MyDataCoordinator, as a top-level coordinator on a tab, owned several child coordinators which contained sub-features.
Therefore, I was keeping the navigation hierarchy for all of these features in memory every time a user logged out and back in. This also included coordinators, factory classes, services, and many @ObservedObject view models cached in memory.
The name of the game
Now we understand the problem, it's easy to verify when we've solved it.
Instead of going through the rigamarole of triggering a deep link, we just need to ensure that our MyDataCoordinator is deallocated when we logout.
When debugging memory leaks, deinit is your best friend. I added them to all 3 of the main tab coordinators.
deinit {
  print("deinit (self)")
}
This was called for 2 tab coordinators on logout, but not for MyDataCoordinator (which held the problematic deep link). This meant all the entities and child coordinators it strongly referenced also stayed alive.
Now we know the name of the game: when deinit fires on logout, we've won.
Search and destroy
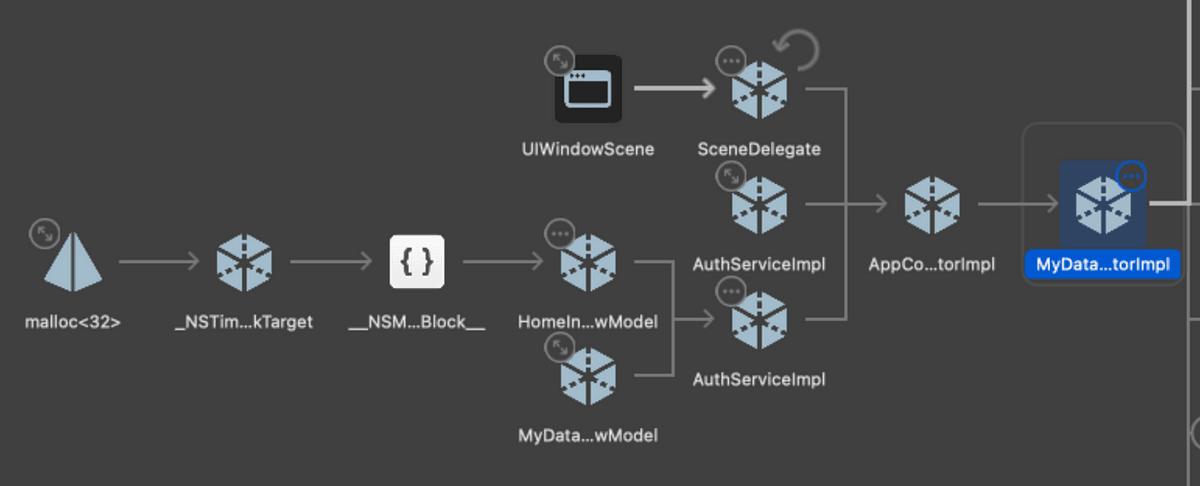
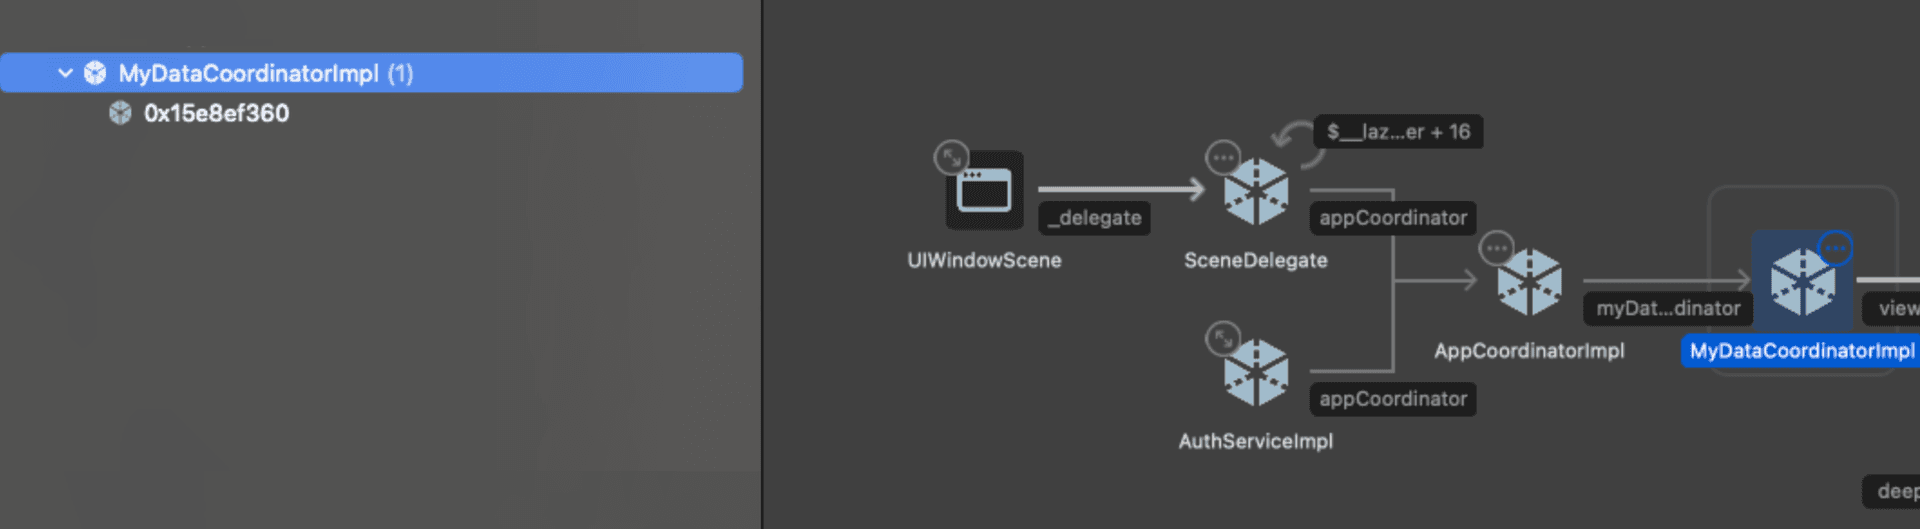
Harking back to the memory graph debugger, we look for a smoking gun: a strong reference that shouldn't be there.
We can inspect the memory graph for each instance, and it's clear on comparison which is the "good" one - this version of MyDataCoordinator sits nicely in the memory graph with our main navigation infrastructure such as SceneDelegate and AppCoordinator.
However, there also looks to be a circular reference from a view model which we don't expect.
The leaked instance is pretty obvious: There's a single reference keeping our coordinator alive, alongside a hive of low-level memory entities.
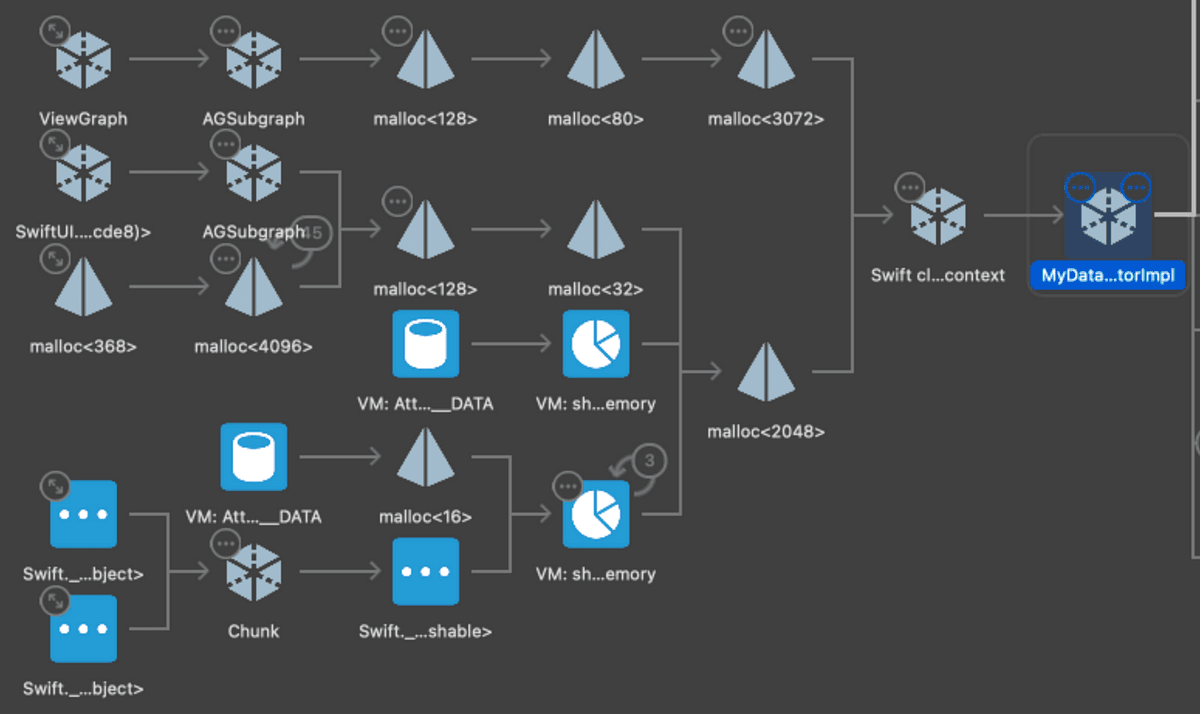
Since the strong reference doesn't have a name, it suggests there's an anonymous function (i.e. a closure) rather than a named class with a strong reference.
Wanting to be very clever, I opened Instruments to search for leaks and allocations in my coordinator. Unfortunately, the output didn't give us any new information.
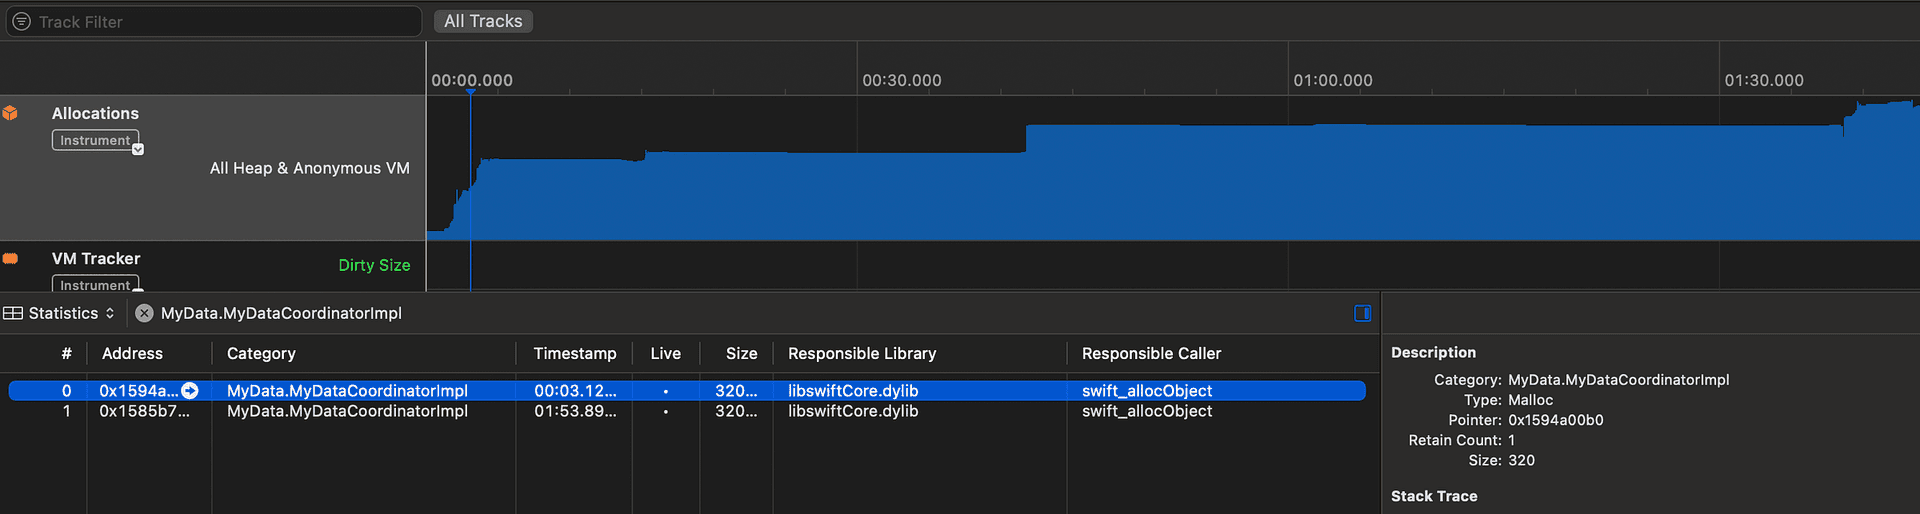
We've gone as far as we can using Xcode's instrumentation. We need a new tactic: methodically reading through our codebase to search for the offending closure.
Divide and conquer
When the source of any bug isn't obvious clear, a good approach is to minimise the error surface area.
The way to do this by time is with a command like git bisect. By space, you can do this through a more blunt tool: commenting out lots of code.
To start with, I can comment out as much as possible while still being able to build the app, including all the child coordinators, navigation logic, and private methods. Then I can check whether the MyDataCoordinator is de-inited on logout.
It is!

I repeated the approach systematically, isolating each methods and child coordinator one at a time, repeating the bug repro steps for each build.
Until I spotted the culprit.
The Culprit
I isolated the offending block of code.
12 lines which made the difference between leaking our whole navigation stack, or our app behaving as intended.
This block was also part of our deep linking logic, however it was more complex than a simple screen navigation.
For fraud prevention, users could only access this feature if their account was old enough. We sent out links through our CRM once they qualified. Therefore, before we perform the navigation, we perform an asynchronous check with our API that the user's account is eligible. If this succeeds, we perform the navigation.
Here's the code - see if you can spot the issue!
private func setupSpecialOffersDeepLink() {
  deepLinkHandler
      .publisher(for: .specialOffersDeepLink)
      .sink(receiveValue: {
          Task { [weak self] in
              if (await self?.offersService.userIsEligible() == true) {
                  self?.navigate(to: .specialOffersScreen)
              }
          }
      })
      .store(in: &cancellables)
}
Honestly, it's sort-of obvious, sort-of not. You might kick yourself once I explain it.
Fixing the leak
The code, on the face of it, looks like it's doing everything it can to avoid a retain cycle. It captures self weakly before it uses it. It stores the combine publisher in a set of cancellables.
But there's one snag.
It's only clear once you really understand what a closure is doing in Swift.
When we weakly capture self using Task { [weak self] in, we are indeed creating a weak reference to self.
However, this capture itself happens while already in a closure, the closure passed into the Combine .sink(receiveValue: {.
A closure is a block of code stored on the heap, separate from the class in which it was created. Therefore, the self used in the Task's [weak self] is an implicit strong reference to self, rather than the original entity.
We need to put [weak self] on the .sink closure instead of the Task initializer:
private func setupSpecialOffersDeepLink() {
  deepLinkHandler
      .publisher(for: .specialOffersDeepLink)
      .sink(receiveValue: { [weak self] in
          Task {
              if (await self?.offersService.userIsEligible() == true) {
                  self?.navigate(to: .specialOffersScreen)
              }
          }
      })
      .store(in: &cancellables)
}
Updating the code, and running through the repro steps, our deinit is called on logout! The memory leak is solved.
Looking at the memory graph debugger, we see the single instance of MyDataCoordinator as we'd expect, without any unwelcome references we don't expect.
Conclusion
So I had a memory leak. Big deal.
A leak caused by using [weak self] wrongly. 🤷♂️.
But this bug felt worth writing about. The symptom reported by our users was a seemingly minor "weird navigation animation". Tapping a deep link sometimes caused the push animation to happen twice.
I couldn't have predicted an underlying issue as dramatic as "half of our app's features duplicated in memory", whenever a user re-logged. Or a solution as simple as moving a [weak self] capture one line up.
The problem nested closure was superficially acceptable code, with a very subtle retain cycle. Once through code review and merged, the bug wasn't obvious at all.
There's a moral to this story. When did you last check the Xcode memory graph debugger with your app? Perhaps you have an unassuming P4 bug sitting in your backlog, with a dramatic memory leak lurking under the surface.
This was an Emerge Tools guest post from Jacob Bartlett. If you want more of his content, you can subscribe to Jacob's Tech Tavern to receive in-depth articles about iOS, Swift, tech, and indie projects every 2 weeks; or follow him on Twitter.