Measuring the performance of iOS apps is typically done by profiling an app to calculate how much time is spent in each function. Usually you'd do this with the Time Profiler in Xcode Instruments, but it is known to be slow and unreliable.
Emerge offers a profiling tool as part of Performance Testing in CI. This profiling is visualized as a flame graph, and has proven to be an easy way to gain insights about bottlenecks in app performance, and identify solutions. Today, we're introducing a new way to use the same great profiling visualizations that is entirely local and open-source.
ETTrace is an open-source framework written in Objective-C
and a CLI in Swift that profiles and visualizes entirely locally. It's built to be easy and fast — just link the framework
to your app, run ettrace to start profiling and stop to instantly see your flame chart. No restarting the app or clicking
through long menus to see results.
Why we need a new profiler
Emerge's Performance Analysis is designed to prevent regressions from being merged to your codebase. It gives you consistent results for specific scenarios configured in CI. However, pushing to CI is not ideal when you're debugging. You need something fast and local.
ETTrace let's you easily debug a performance issue. If you're using Emerge, you can then validate your fix by pushing to CI when you're ready. Additionally, you can explore all code paths in your app without writing specific tests. If you identify performance critical paths with ETTrace, you can then set them up to be monitored in CI.
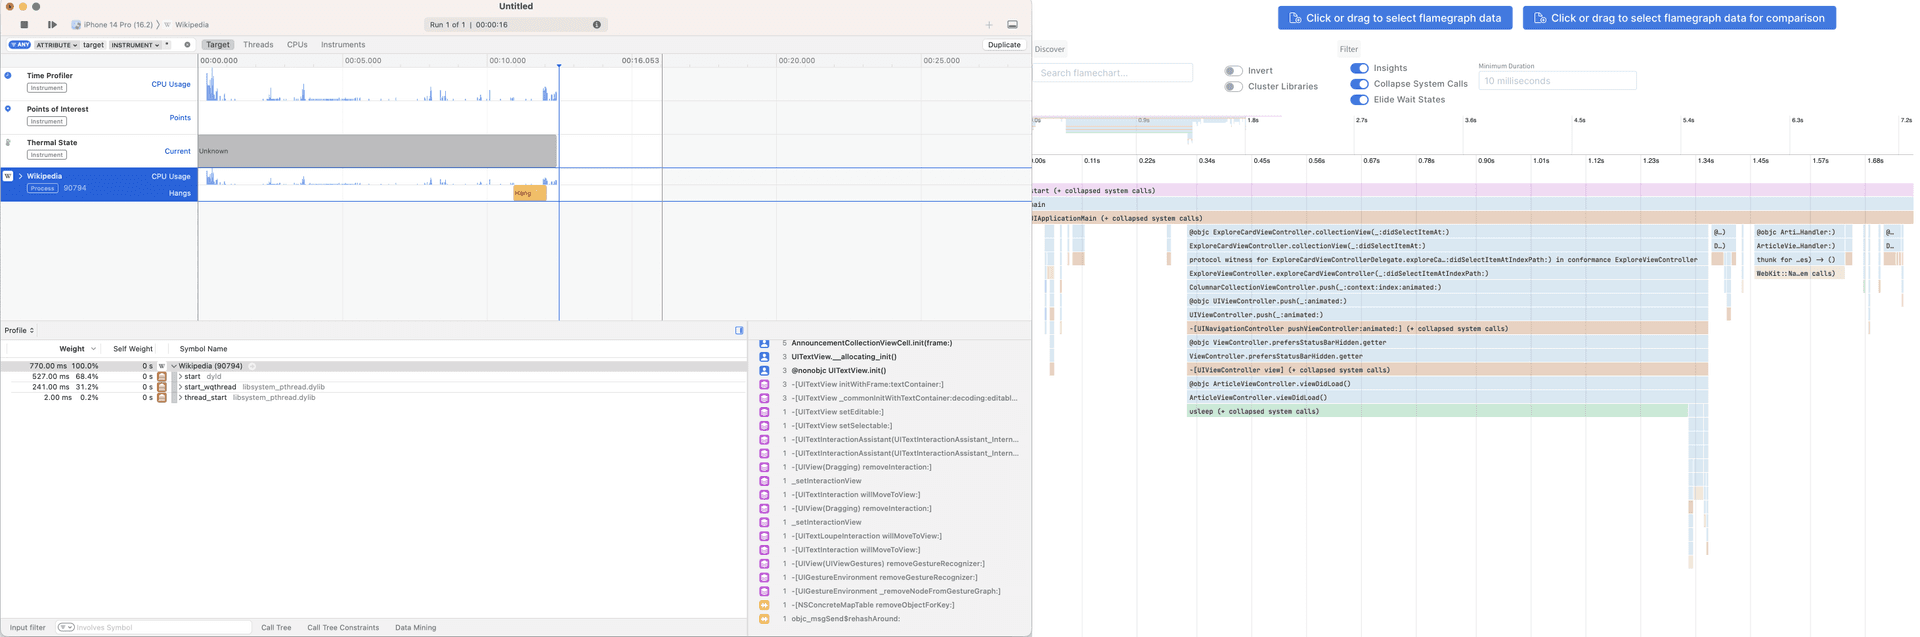
You might wonder why not just use Instruments for this? While the Time Profiler is the state of the art for iOS profiling, it can be difficult to use without being a performance expert (and even for performance experts). This is partly due to the non-intuitive visualizations, but also due to the unwieldy nature of the tool.
At Emerge I've talked to many engineers working on large apps and the feedback is all the same: Time Profiler can be flaky and slow. Even getting the screenshots for this article I encountered multiple freezes and needed to force-quit. Symbolication is frequently a problem, with traces being generated and only showing addresses but not function names.
ETTrace supports symbolication in two ways. First, if you have dSYMs you
can directly supply them to the tool through the --dsyms argument. Second, for simulator builds, ETTrace will automatically use the symbol table
in the app binary to symbolicate. Since the tool is open source, if you have any issues with symbolication it's easy to debug - unlike Instruments.
How sampling works
ETTrace is a sampling based profiler, meaning it records the stack at fixed intervals to build the visualization. The sampling is for the main thread only, which is where you typical find user facing performance issues such as hangs. Sampling is done on a background thread roughly like this:
sStackRecordingThread = [[NSThread alloc] initWithBlock:^{
  NSThread *thread = [NSThread currentThread];
  while (!thread.cancelled) {
      [self recordStack];
      usleep(4500);
  }
}];
Each recording includes the list of addresses observed in the stack, and the current timestamp. Addresses are
symbolicated after the trace is done recording, and the symbolicated versions are aggregated. The maximum amount
of time between any two stacks should be 5ms (accounting for usleep taking up to 0.5ms longer than the time we specify). To ensure
traces are accurate, any extra time longer than this is accumulated and reported as <unattributed>.
The visualization is technically a flame chart, which means nodes are ordered by time on the x-axis. It follows this data structure:
struct FlameChartNode {
let name: String
let duration: Double
let children: [FlameChartNode]
}
The visualization generated by Emerge performance testing is a flame graph, where stacks are aggregated at each level by name. Each node does not have a specific start/end time because they are not ordered, they only have a duration on the x-axis. The data structure looks like this:
struct FlameGraphNode {
let duration: Double
// Children is keyed by node name
let children: [String: FlameGraphNode]
}
Since ETTrace only visualizes a single trace of the app (rather than an average of many traces) the data is a flame chart which can be easier for debugging. ETTrace also has a diffing feature, where you can upload two traces and compare them to see how a function has improved or regressed. When this is used, the visualization will be a flame graph.
Understanding protocol conformances
As a case study of using ETTrace, let's look at how to analyze the impact of protocol conformances on app launch. We'll use the open
source Mastodon app as our example, but modified to include many more protocol conformances. Normally you would use ETTrace after
the app has launched, but to profile directly from launch we add the key ETTraceRunAtStartup set to YES to the Info.plist.
Now we can launch the app with ETTrace.framework linked and start profiling! Make sure the app is deleted from your
phone before installing from Xcode. Then, install but don't launch the app. Finally, run ettrace at the command line and follow
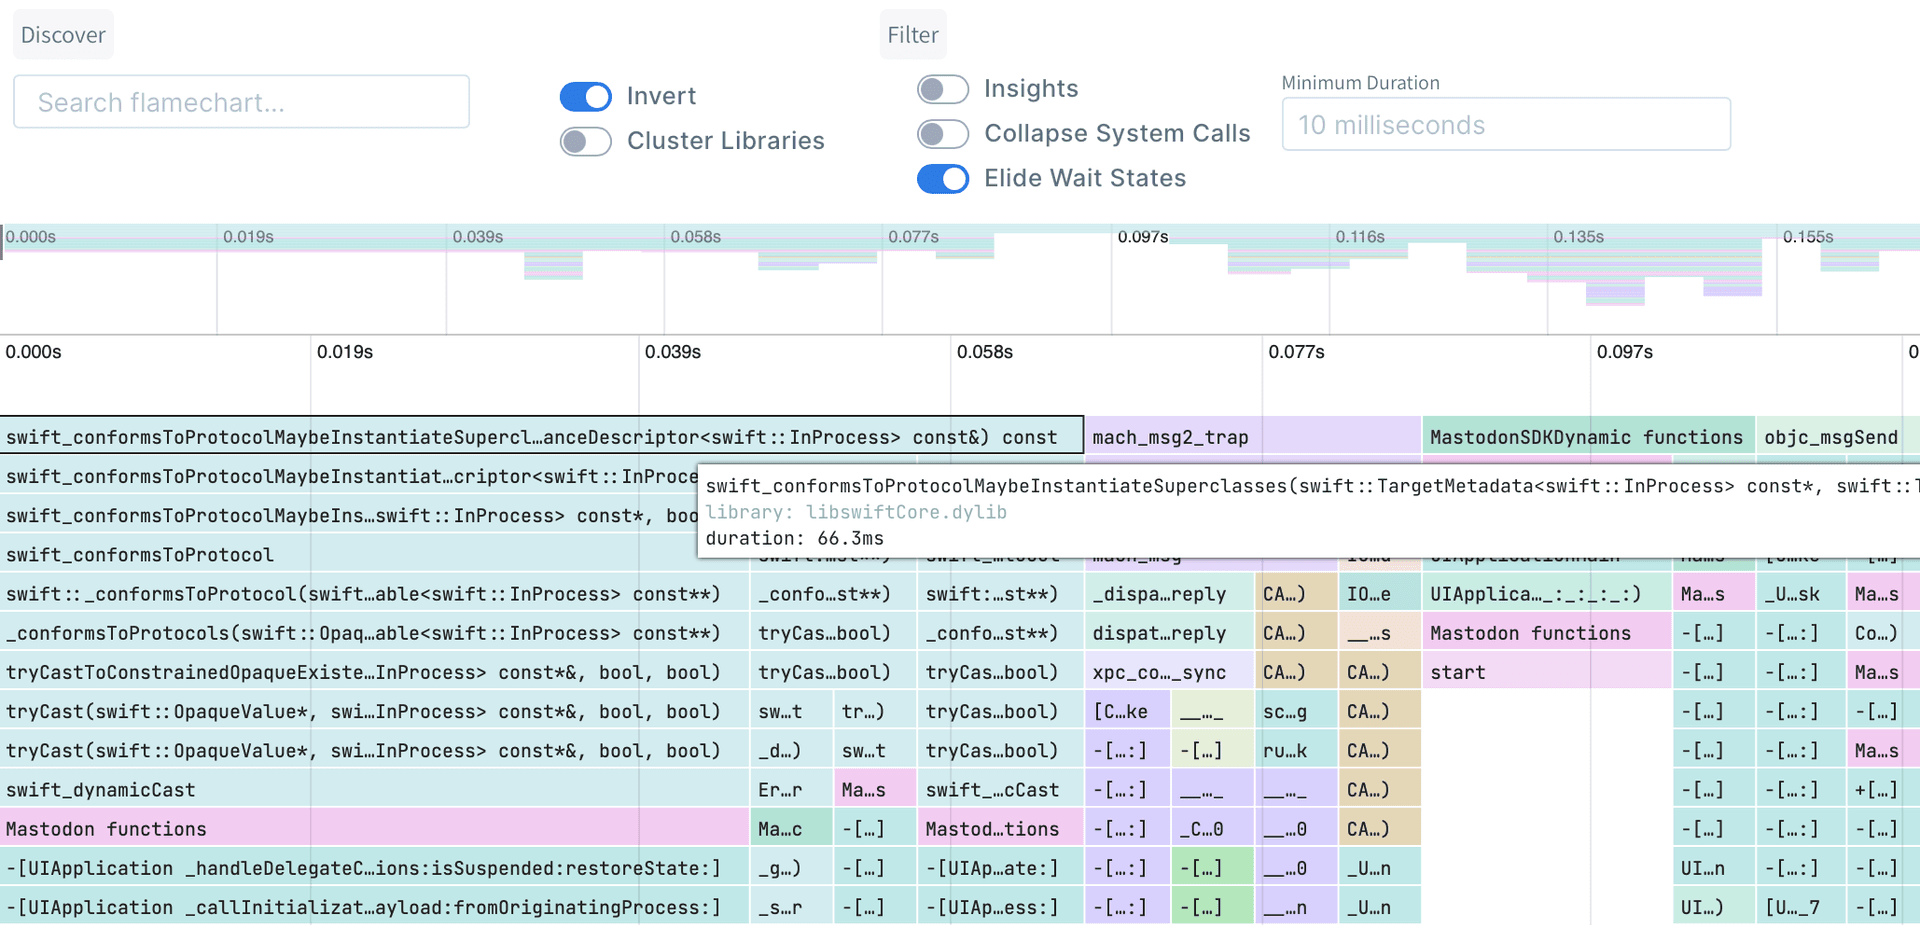
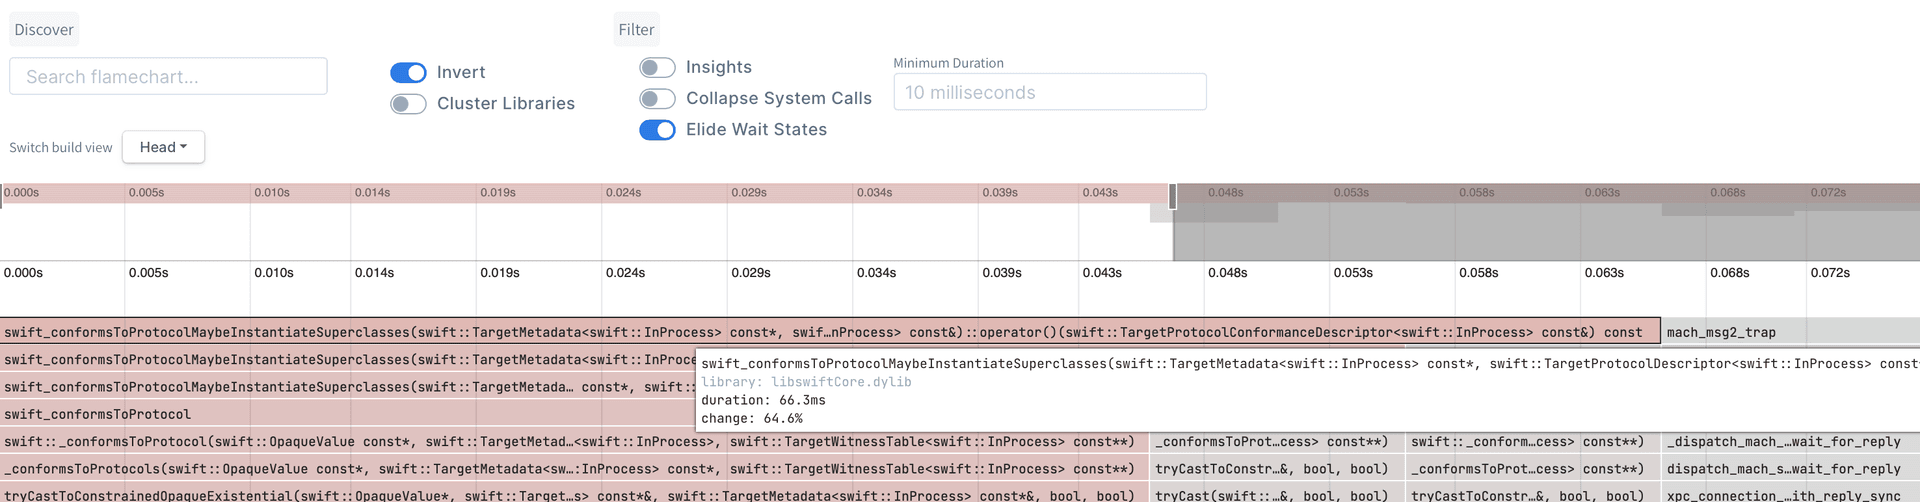
the prompts including launching the app manually from the home screen. The resulting flame graph shows a large amount of time spent in
protocol conformances: over 60ms!
Next, try launching the same app a second time and running ettrace to get the trace. This time conformance lookups
are so fast, ETTrace doesn't even sample them! By selecting both traces you can use the differential flame graph to
confirm the reason for the slowdown.
This demonstrates that protocol conformances still use the slow path on the first launch of an app in
iOS 16 (including after installing an update) and are very fast for subsequent launches. However, other kinds of protocol
conformance checks, such as when the result of an as? operation is nil can still be very slow. Running your app locally
with ETTrace can help identify if you have any of these in your app.
Automate in CI
Local performance debugging with ETTrace is just one part of a performance optimization workflow. You want a quick iteration cycle that allows you to evaluate new ideas, but continuous testing and alerts provide an additional safety net to prevent issues from being introduced in production and confirm what you measure locally. Emerge offers a
performance testing feature to do just this. Together local performance debugging with ETTrace and Emerge's Performance Analysis bring a unified performance workflow to developers and results in app performance continuously improving. If you're interested in learning more about these tools feel free to get in touch, and if you have any feedback on ETTrace please open a Github issue!
Thanks to Itay Brenner for his work on this project, and to Filip Busic, Miguel Jimenez, and Keith Smiley for their early feedback testing the tool!